


Why community engagement reports matter
Trust through transparency
Public disengagement and opposition often stems from feeling ignored, not from disagreeing with outcomes. A clear, accessible report can defuse criticism by demonstrating how input was genuinely considered, even when suggestions weren't adopted. When residents see their voices reflected in the decision-making process, trust grows.
Relationship-building that compounds
Feedback loops create ongoing dialogue rather than one-off consultations. The City of Allen, Texas built continuous engagement through weekly communication centered on their engagement platform, creating a community that actively participates because they know their input matters.
Fostering participation
While reporting may not be legally required, treating it as optional misses the strategic value. A thoughtful engagement report signals genuine commitment to collaborative governance and sets the foundation for more meaningful future engagement.
The 5-step framework for effective engagement reports
This practical framework adapts to any project size or type. Think of these steps as building blocks – modify sections to fit your context while maintaining the core structure that ensures clarity and impact.
Step 1: Sketch the context and stakes
Start by giving readers the essential background they need to understand why this project matters and how their input fits into the bigger picture.
Project background
Explain the project's origin story in 2-3 sentences. Was it driven by resident requests, policy requirements, budget priorities, or emerging community needs?
Engagement objectives
Be specific about what you hoped to achieve. Were you:
- Gathering creative ideas for an open-ended challenge
- Testing community reaction to specific proposals
- Prioritizing among competing options
- Building awareness about upcoming changes
Community impact
Connect the project to residents' daily lives. How will this affect their commute, neighborhood character, safety, or quality of life?
Visual summary
Use a timeline, infographic, or summary box to help busy readers quickly grasp key details.
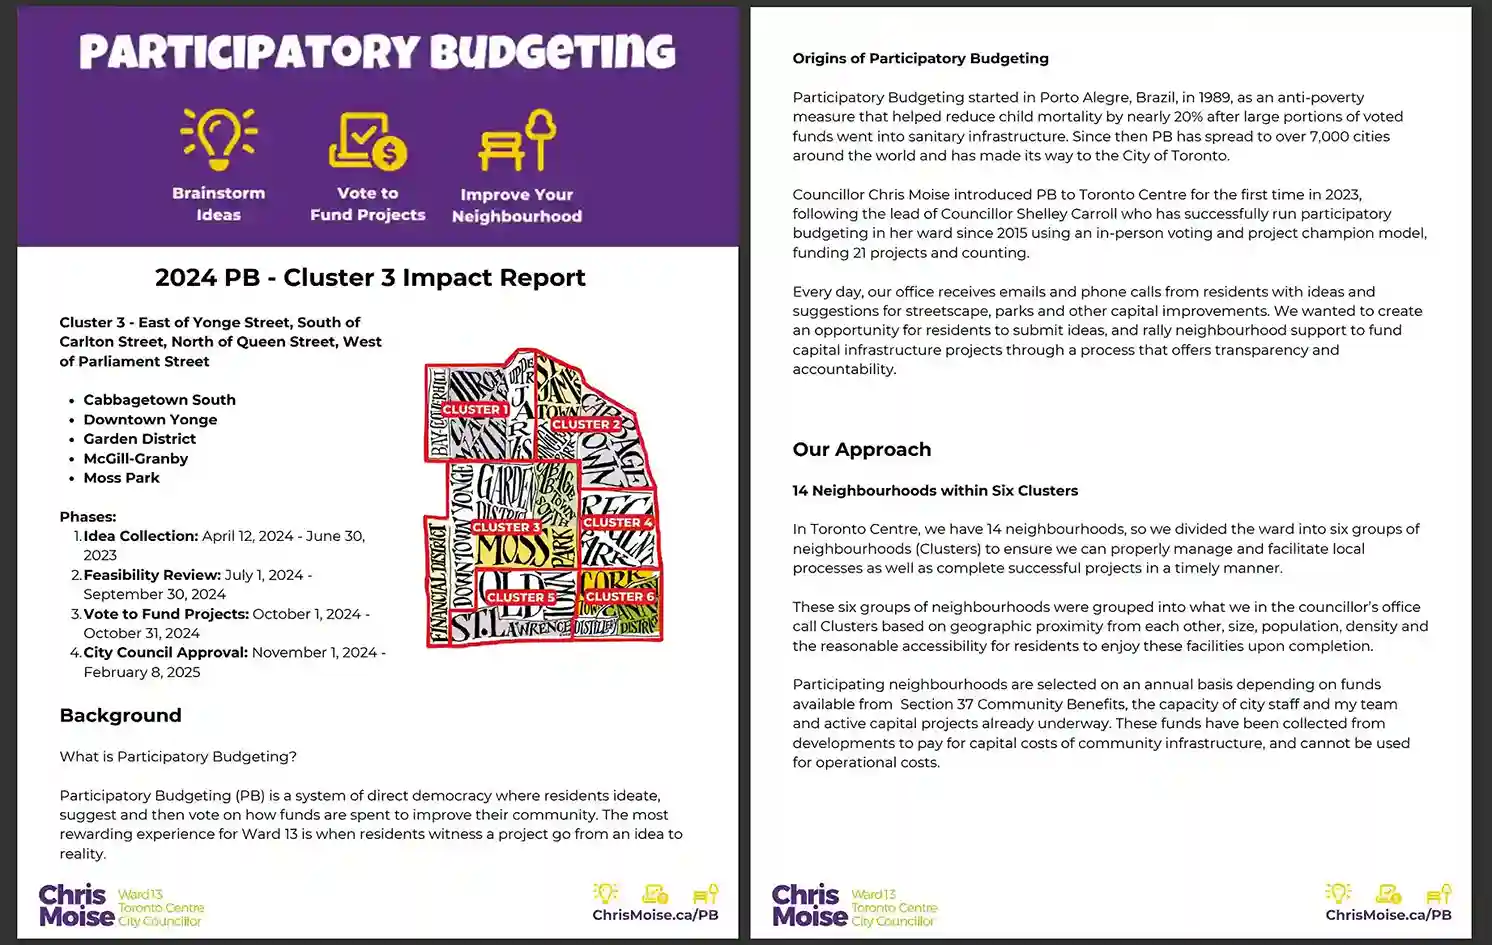
Example from the City of Toronto, Canada
In 2023, Toronto launched a participatory budgeting program in Ward 13, one of its districts. At the end of each budgeting cycle, the engagement team creates an "impact report". Below you can see how each of these begins with a compelling introduction that sets the stage:
Step 2: Document your outreach & engagement strategy
Transparency about your engagement methods helps your community assess the comprehensiveness of your approach and understand the scope of input.
Timeline and phases
Clearly outline when engagement occurred and how it was structured:
- Project launch and information sharing
- Active input collection period
- Follow-up clarifications or deeper dives
- Final feedback opportunities
Engagement channels
Detail where and how people could participate:
- Digital platform: idea forum, surveys, interactive mapping tools
- In-person events: town halls, pop-up booths, walking tours, focus groups
- Hybrid approaches: QR codes at transit stops, comment boxes in libraries, text-based feedback systems
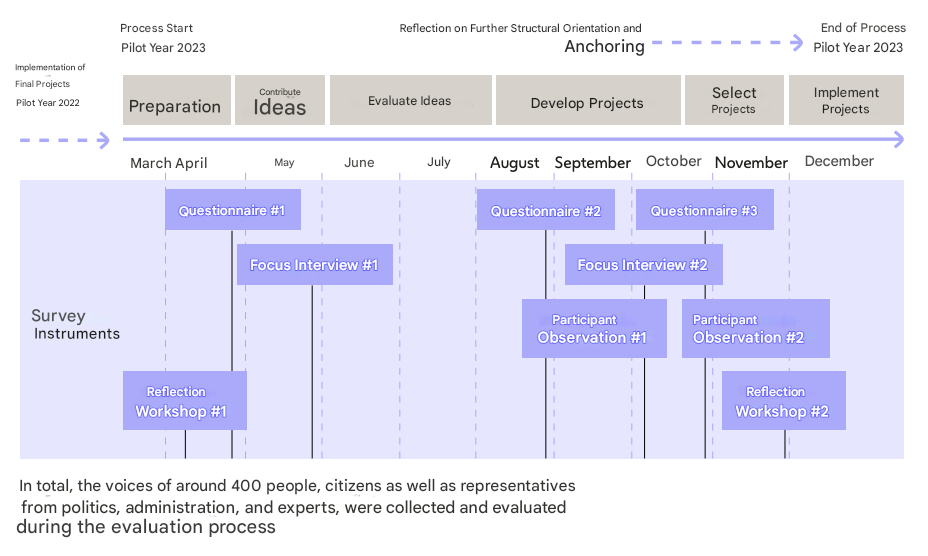
Example from the City of Vienna, Austria
To provide a transparent summary of its engagement strategy, Vienna included this timeline in its pilot evaluation report. It clearly shows when, how, and why engagement took place:
Outreach strategy
Describe how you promoted participation and reached diverse audiences:
- Direct communication (newsletters, social media, local media)
- Community partnerships (schools, religious organizations, business associations)
- Targeted outreach to underrepresented groups
Step 3: Profile your participants
Understanding who participated, and who didn't, is crucial for interpreting results and improving future engagement. Don't stop at just counting participants, report on how diverse the people you heard from are and acknowledge any representation gaps.
Demographic breakdown
Present participation data across relevant categories:
- Age ranges and generational perspectives
- Geographic distribution (neighborhoods, districts, postal codes)
- Housing status (renters, homeowners, business owners)
- Language preferences and accessibility needs
- Any other community-specific demographics
Representation analysis
Compare participant demographics to overall community composition. Use clear visuals:
- Bar charts showing age distribution vs. census data
- Maps highlighting geographic participation patterns
- Pie charts comparing participant housing status to community averages
Inclusion efforts
Document steps taken to ensure broad participation:
- Multi-language materials and interpretation services
- Accessible venues and digital platforms
- Childcare, transportation support, or scheduling accommodations
- Partnerships with community organizations serving specific populations
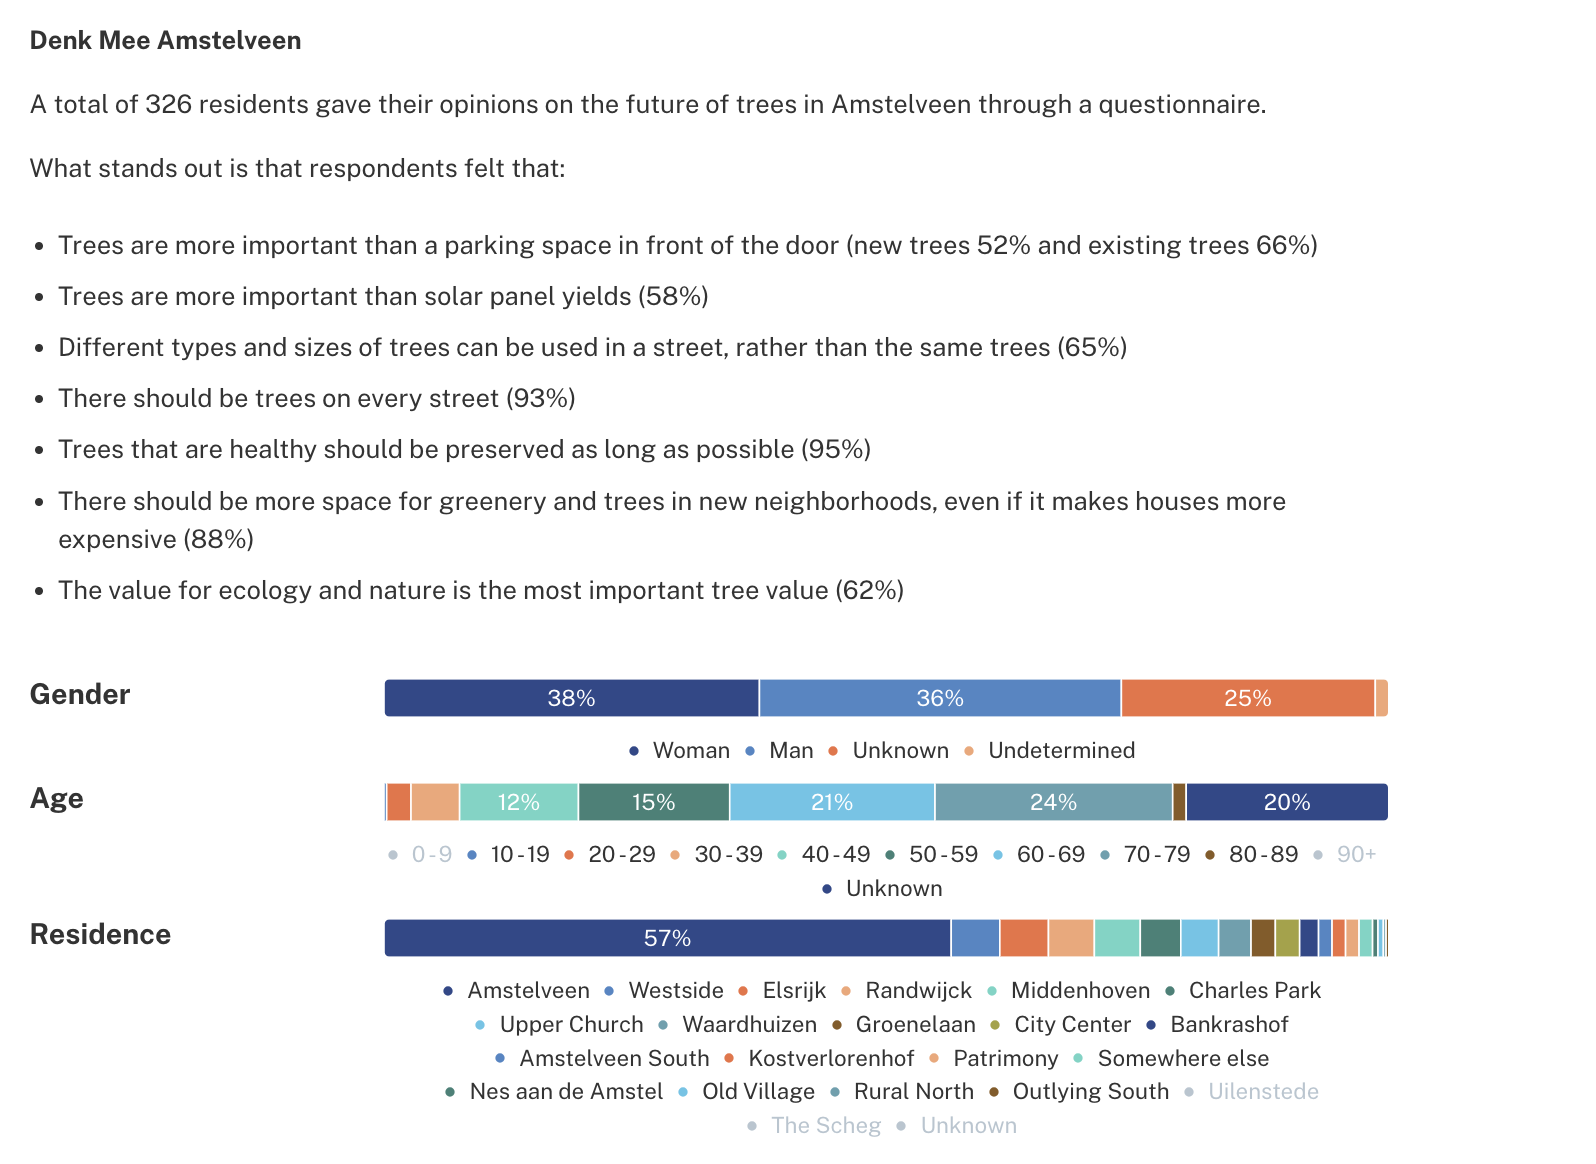
Example from the municipality of Amstelveen, the Netherlands
The Dutch city of Amstelveen invited residents to help shape a long-term vision on tree policy. Through tree walks, questionnaires, and consultation sessions, participants contributed input on priorities like tree health, urban biodiversity, and climate resilience.
Amstelveen tracked participation by gender, age, and residence, presenting results in clean, accessible graphics that immediately showed representation patterns across their community.
Step 4: Share what you heard
This is where you show the substance of the engagement: the opinions, hopes, and concerns shared by your community. The goal isn’t to list every comment, but to clearly show the main messages that came through.
Top themes, concerns, and opportunities
Group what you heard into 3 to 5 key themes. For each one, briefly explain what participants said and why it matters.
These might include:
- Strong support for a specific change
- Areas of concern (e.g., safety, access, cost)
- Creative suggestions from residents
Use short, readable headers for each theme and add 1–2 sentences to explain them in plain language.
Mix qualitative and quantitative input
Pair the numbers with the voices:
- “67% of participants rated better lighting as a high priority”
- “One resident shared: ‘My kids won’t play here after dark, it’s just too poorly lit.’”
Use tools like:
- Charts or bar graphs to show voting results or preferences
- Word clouds to highlight frequently used terms
- Pull-quotes to feature compelling or representative comments
Be honest about tensions and disagreements
Did people disagree? Mention it. Transparency builds credibility.
For example: “While many supported reducing parking to create green space, others raised concerns about access for older residents.”
Highlighting these contrasts doesn’t weaken your report; it strengthens trust by showing that all voices were heard, not only the most common opinions.
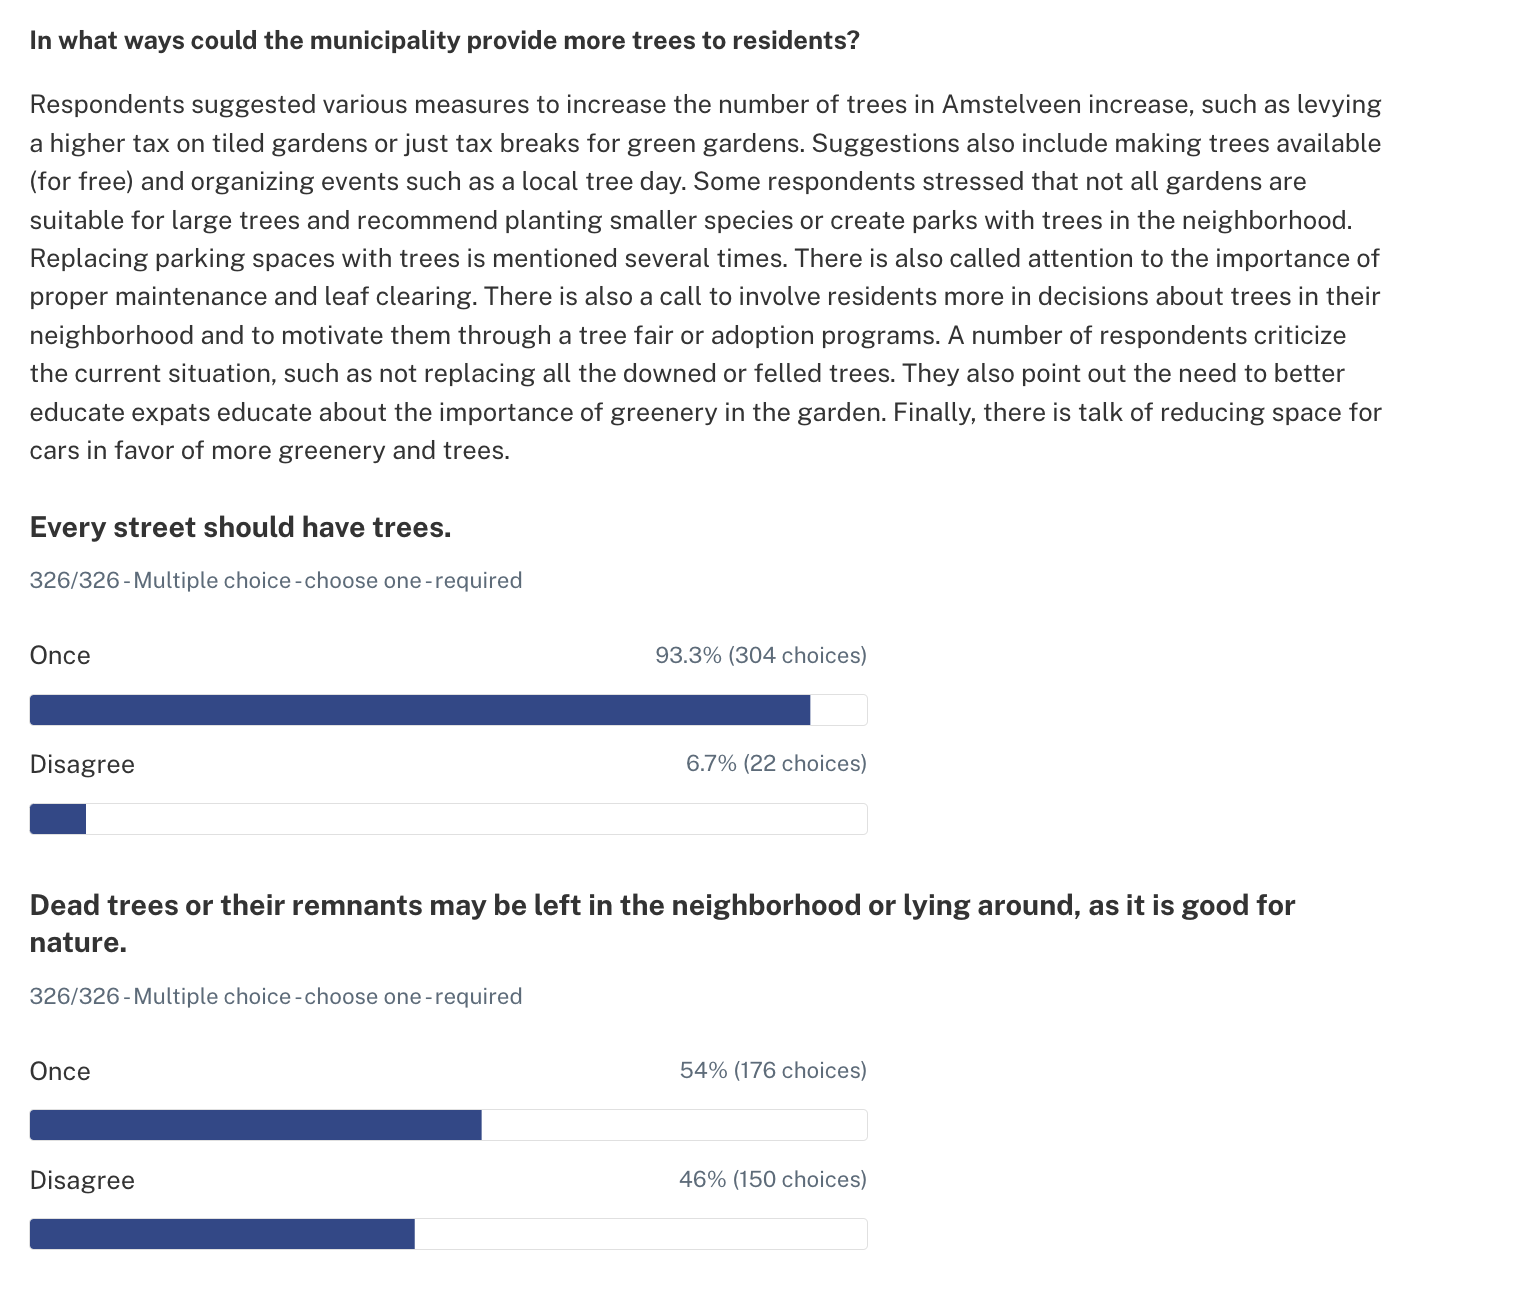
Example from the municipality of Amstelveen, the Netherlands
Amstelveen's tree plan project report features a well-balanced mix of survey graphs and summarized open-ended responses, helping readers understand both the quantitative trends and the nuanced feedback from participants.
Step 5: Show impact and next steps
Close the loop by demonstrating how community input influenced decisions and outlining what happens next. This is where trust is built or broken.
Prove decisions are input-driven
Connect the feedback you received to decisions to make residents see how their voices shaped outcomes, whether through direct implementation or influenced alternatives. For instance, you might explain that "Based on strong support for improved lighting, we've allocated $150,000 for LED streetlight upgrades along Main Street".
It's also important to acknowledge constraints honestly: "While many suggested a new parking structure, budget constraints require us to focus on improving existing lots first." This shows that community input had real influence on decision-making, even when the final outcome differs from initial suggestions.
Post-engagement timeline
In this section, you should also provide residents with a clear roadmap that includes specific dates and milestones they can track. Walk them through the design development phases, public approval processes, construction or implementation periods, and planned progress check-ins. Include milestone celebrations or community events that will mark significant progress points.
This timeline transforms abstract promises into concrete commitments that residents can follow and hold you accountable to deliver.
Continued engagement opportunities
Make it easy for residents to stay involved throughout implementation and beyond. Establish regular project updates through newsletters or platform notifications, create opportunities for input on implementation details as they arise, and provide clear contact information for ongoing questions or suggestions. Link to related upcoming projects where residents can apply their engagement experience, building a pipeline of ongoing community involvement that extends beyond any single initiative.
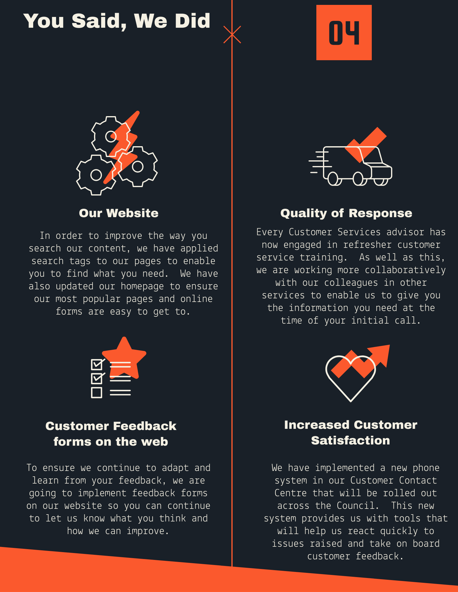
Example: "You Said, We Did"
The classic “You said, we did” format is straightforward but highly effective to wrap up your report.
Three strategies for maximum report impact
Creating an excellent report is only half the challenge, ensuring it reaches and resonates with your community requires strategic communication.
1. Prioritize accessibility
- Use plain language and avoid jargon
- Offer multiple formats (web page, PDF, video summary, printed handouts)
- Include alt-text for images and ensure screen reader compatibility
- Translate key findings into community languages
2. Distribute strategically
- Publish prominently on your main website and engagement platform
- Share excerpts through social media, newsletters, and local media
- Present findings at community meetings and events
- Partner with local organizations to extend reach
3. Celebrate participation
- Publicly thank residents for their time and insights
- Spotlight compelling community stories and suggestions
- Show photos from engagement events (with permission)
- Acknowledge the collective effort that made the project possible
Streamline your process with integrated tools
Go Vocal's engagement platform can dramatically reduce the time and effort required to produce high-quality reports while improving their comprehensiveness and impact.
Break data silos
Our Form Sync feature lets you digitize paper survey responses, sticky notes, and other written input, creating one organized dataset that combines offline and online contributions. This eliminates hours of manual data entry while ensuring no voices are lost.
AI-powered analysis
Our AI input analysis tool Sensemaking organizes qualitative feedback into clear themes and generates plain-language summaries, helping teams work up to 850% faster than manual spreadsheet analysis. The Auto-insights module uncovers statistically significant patterns, like how responses vary by age group or neighborhood, without requiring data science expertise.
Built-in report generation
Our integrated Report Builder enables you to combine charts, quotes, summaries, and visuals into polished reports that can be formatted for internal use or published directly to engagement platforms with consistent branding. This transforms reporting from a time-intensive burden into a streamlined process.
Already working with us? Explore the Report Builder in your platform, or contact your Government Success Manager for personalized support.
Not yet a member of our Go Vocal client community? Download our free Community Engagement Report Template to apply the tips in this article in practice, and schedule a demo to see how our platform can streamline your community engagement.