

Step 01
Start from your ambition
What do you want to achieve by the end of 2027?

Before you plan a project, set a target: how many registered residents by the end of 2027?
Engagement teams tell us they get brought in too late, after departments have decided what to consult on. With a target, you set the direction before the first project goes on the calendar.
In the typical city, 6.1% of residents are registered.
That is the median across cities that have been on Go Vocal for at least two years.
Smaller cities sign up a larger share.
Next, find the number for a city your size.
For your 2027 plan
Your ambition first, then your calendar.
Find your big projects.
Much of next year’s engagement is already written down: in your city’s strategic plan, in department plans and budgets, in the decisions scheduled for 2027. Read the plans, then talk to departments, before they come to you.
Pick your goal.
Reach more residents? Build trust? Give residents real influence? Reach the people you never hear? Or meet legal obligations? Most teams want a bit of each, but the goal you put first should shape what you ask, when you engage and report back.
Set your participation target.
Take your number from the calculator above and make it your target for the end of 2027.
Step 02
Choose your topics
Which topics do residents show up for?

Trees, road works and playgrounds draw few residents.
Each tile is a topic, sized by its share of all participants. Cities run plenty of these projects, and few residents join them: playgrounds are 4% of projects and 2% of participants.
Their safety, their squares and their city’s budget draw more.
Residents turn up for a decision they can see: about their place, their money or their safety.
A budget residents can spend draws the most.
Participatory budgets are 3.2% of projects and 7.1% of participants. Public votes for local awards are 1% of projects and almost 4% of participants. A light vote gets people onto your platform, and they come back for bigger decisions.
Share of all participants, by topic
- Participatory budgets7.1%
- Parks and green spaces4.9%
- Budget consultations4.0%
- Public votes for local awards3.8%
- Community safety2.8%
- Squares and village centers2.6%
- Playgrounds2.0%
- Road works1.2%
- Trees and greening, 0.3%
Share of all participants across all topics, November 2024 to October 2025. Each city counts for at most 10 projects per topic. These nine topics add up to 29%.
Three topics are rising fast, each for a reason you can plan for.
-
Community safety
It doubled in a year: cities must renew their safety rules, and they ask residents first. In Harderwijk, in the Netherlands, 823 residents marked on a map where they feel unsafe.
-
Public transport
Responsibility for public transport is moving to the local level. In Wokingham, in the United Kingdom, 1,814 people helped shape the future bus network.
-
Citizens’ panels
Cities are replacing advisory committees with permanent panels of residents. New Westminster, in Canada, made its community assembly permanent. See how Newham runs community assemblies
For your 2027 plan
Put decisions residents can see on the calendar.
Turn decisions into questions with options.
A vote on clear options draws more people than comments on a finished plan. Give residents something to choose between. See how a participatory budget does it.
Learn from cities facing the same challenge.
Another city has already run the project you are about to plan. Start from what worked there. Browse the case studies.
Plan for what is coming.
Check which rules your city renews in 2027 and which responsibilities it takes on. Residents will want a say there.
Go deeper: the rising topics by region
| Topic and region | Year to Oct 2025 | Year to Oct 2026 |
|---|---|---|
| Community safety, United Kingdom | 33% | 50% |
| Community safety, Netherlands | 9% | 26% |
| Public transport, United Kingdom | 15% | 37% |
| Citizens’ panels, North America | 2% | 11% |
Share of cities with at least one project on the topic. Every Dutch city adopts a new safety plan at least every four years, and many current plans end in 2026. In the United Kingdom, cities can now redesign their bus networks. One topic fell: strategic plans, from 11% to 8% of cities, in line with the election calendar.
Step 03
Maximize reach
How do you reach more residents through the year?

Engage all year, and you reach far more residents.
This is our strongest finding. We compared each city with itself, year by year. In a sporadic year, a city launches projects in one or two quarters, then goes quiet.
The same city, always on, reaches 5.3 times as many residents.
Always on means launching projects in three or four quarters. The gain showed up in 85% of the 220 cities we could compare. Each project still drew almost as many people, so more projects meant more residents, and more of them came back.
Launch your biggest projects in September or January.
A September launch draws 1.8 times as many people as a June launch. January draws 1.6 times. June runs straight into the summer. In September and January, people are back at work and school, with a full season ahead.
Three cities that stay open between projects
-
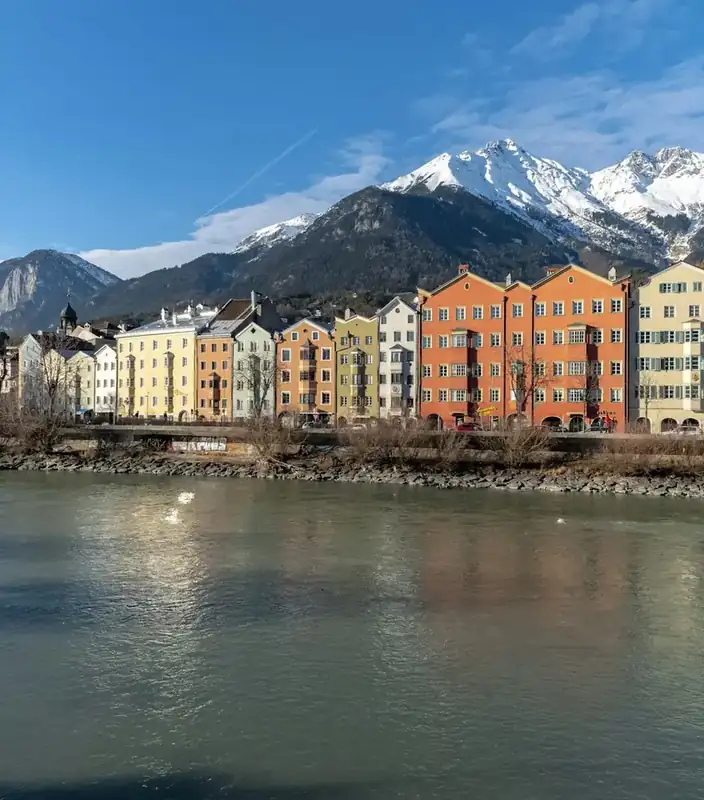 Always on · Citizen proposals
Innsbruck
1,602 participants. Residents post a proposal, and enough votes put it on the city’s agenda.
-
 Always on · Community monitor
Cape Town
1,388 participants. A standing survey of how residents rate life in their city.
-
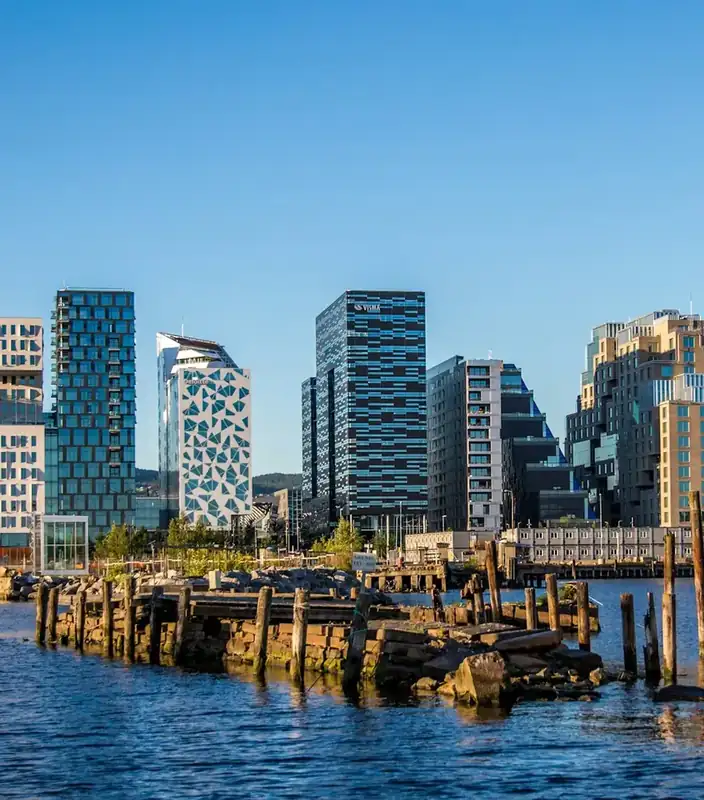 Quick one-off · Naming
Oslo
2,945 participants. Residents proposed names for the city’s future districts.
Participants from January to September 2026.
25 ways to involve residents between big projectsFor your 2027 plan
Keep something open all year.
Count your empty quarters.
Look at this year’s calendar and mark the quarters when residents had nothing to take part in. Fill those first in 2027.
Move your biggest launch.
If a big consultation is set for June, check whether it can wait until September. If it cannot, bring it forward to January.
Pick one always-on format.
A proposals page, a panel or a standing survey. One is enough to start. See how citizen proposals work.
Go deeper: what the widest-reaching cities run
In the top 25% of cities by share of adults reached, 17% of projects are recurring formats such as participatory budgets, proposals and panels. In the other cities it is 10%. Residents also come back more often in always-on cities: 6.8% of participants took part in a second project, against 2.8% in sporadic ones.
The month pattern is a correlation. It changes by year, and within a single city the months sit closer together, so part of the effect is which cities launch when.
Step 04
Close the loop
How do you bring residents back?
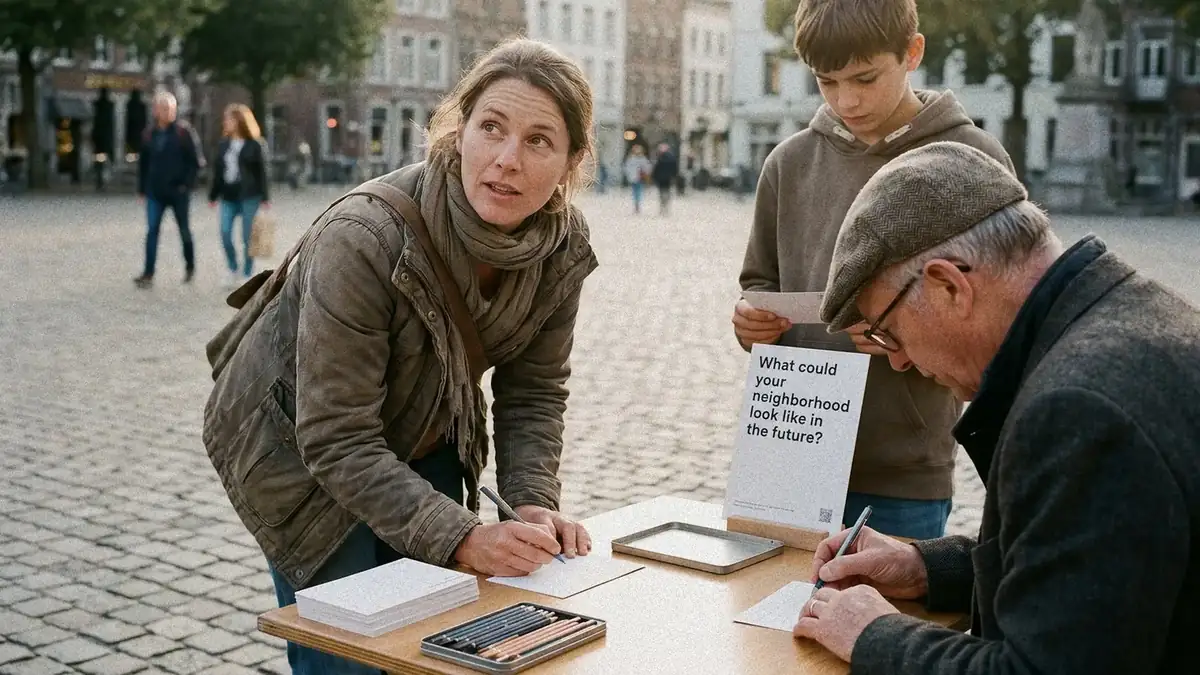
A hundred residents post an idea.
Asking is half the work. Whether residents join your next project depends on what you do after they answer.
When they hear nothing back, 14 take part in another project.
The rest do not return. A project that ends in silence makes the next one harder.
When their idea gets an official answer, 22 come back.
Eight more in every hundred. Residents who get an answer are more likely to join the next project.
Yet half of projects end without a clear follow-up.
On Go Vocal, 47% of projects that asked residents for input had a follow-up. This is where your team can stand out.
The decision takes months? Close the loop in two stages.
Teams often ask us: the decision comes later, so what can we report now? Start with what you heard.
Then come back with what you decided.
Stage one · Right awayWhat we heard
- A quick updateCopenhagen posted six updates on one resident’s proposal, from the first vote to the day it was funded.
- A reportNoosa, in Australia, published its report a month after the survey closed, listing what happens to each request.
Stage two · When the decision is madeWhat we decided
- The final planSouthwark, in London, showed residents what changed in its playground design and what could not, with the reason for each.
- The implementationWhat happened to the winning ideas, all the way to opening day.
For your 2027 plan
Tell residents what happened.
Share what you heard, early.
Within weeks of the project closing. Read how Copenhagen does it.
Explain what you decided.
Include what could not be done, and why.
Start the report from a first draft.
AI sensemaking and autogenerated reports give you a first draft to check and edit. See AI sensemaking.
Go deeper: how sure are these numbers
Coming back means taking part in another project on the same platform at least 30 days later: 13.8% without an official answer, 22.3% with one. This is a correlation, and the gap changes by year: 15% against 26% in the first twelve months, 14% against 17% in the latest twelve.
A follow-up is a status change on an idea, an official answer, published results or an information phase after the participation phase. Counting only the first three, 17% of projects visibly closed the loop.